Ground Pipeline
This guide demonstrates how to set up and execute ground-based image processing pipelines using rover (e.g., Amiga) data. It covers workspace creation, plot marking, image stitching, and running inference models.
Video Tutorial
Watch the full guide on Guidde

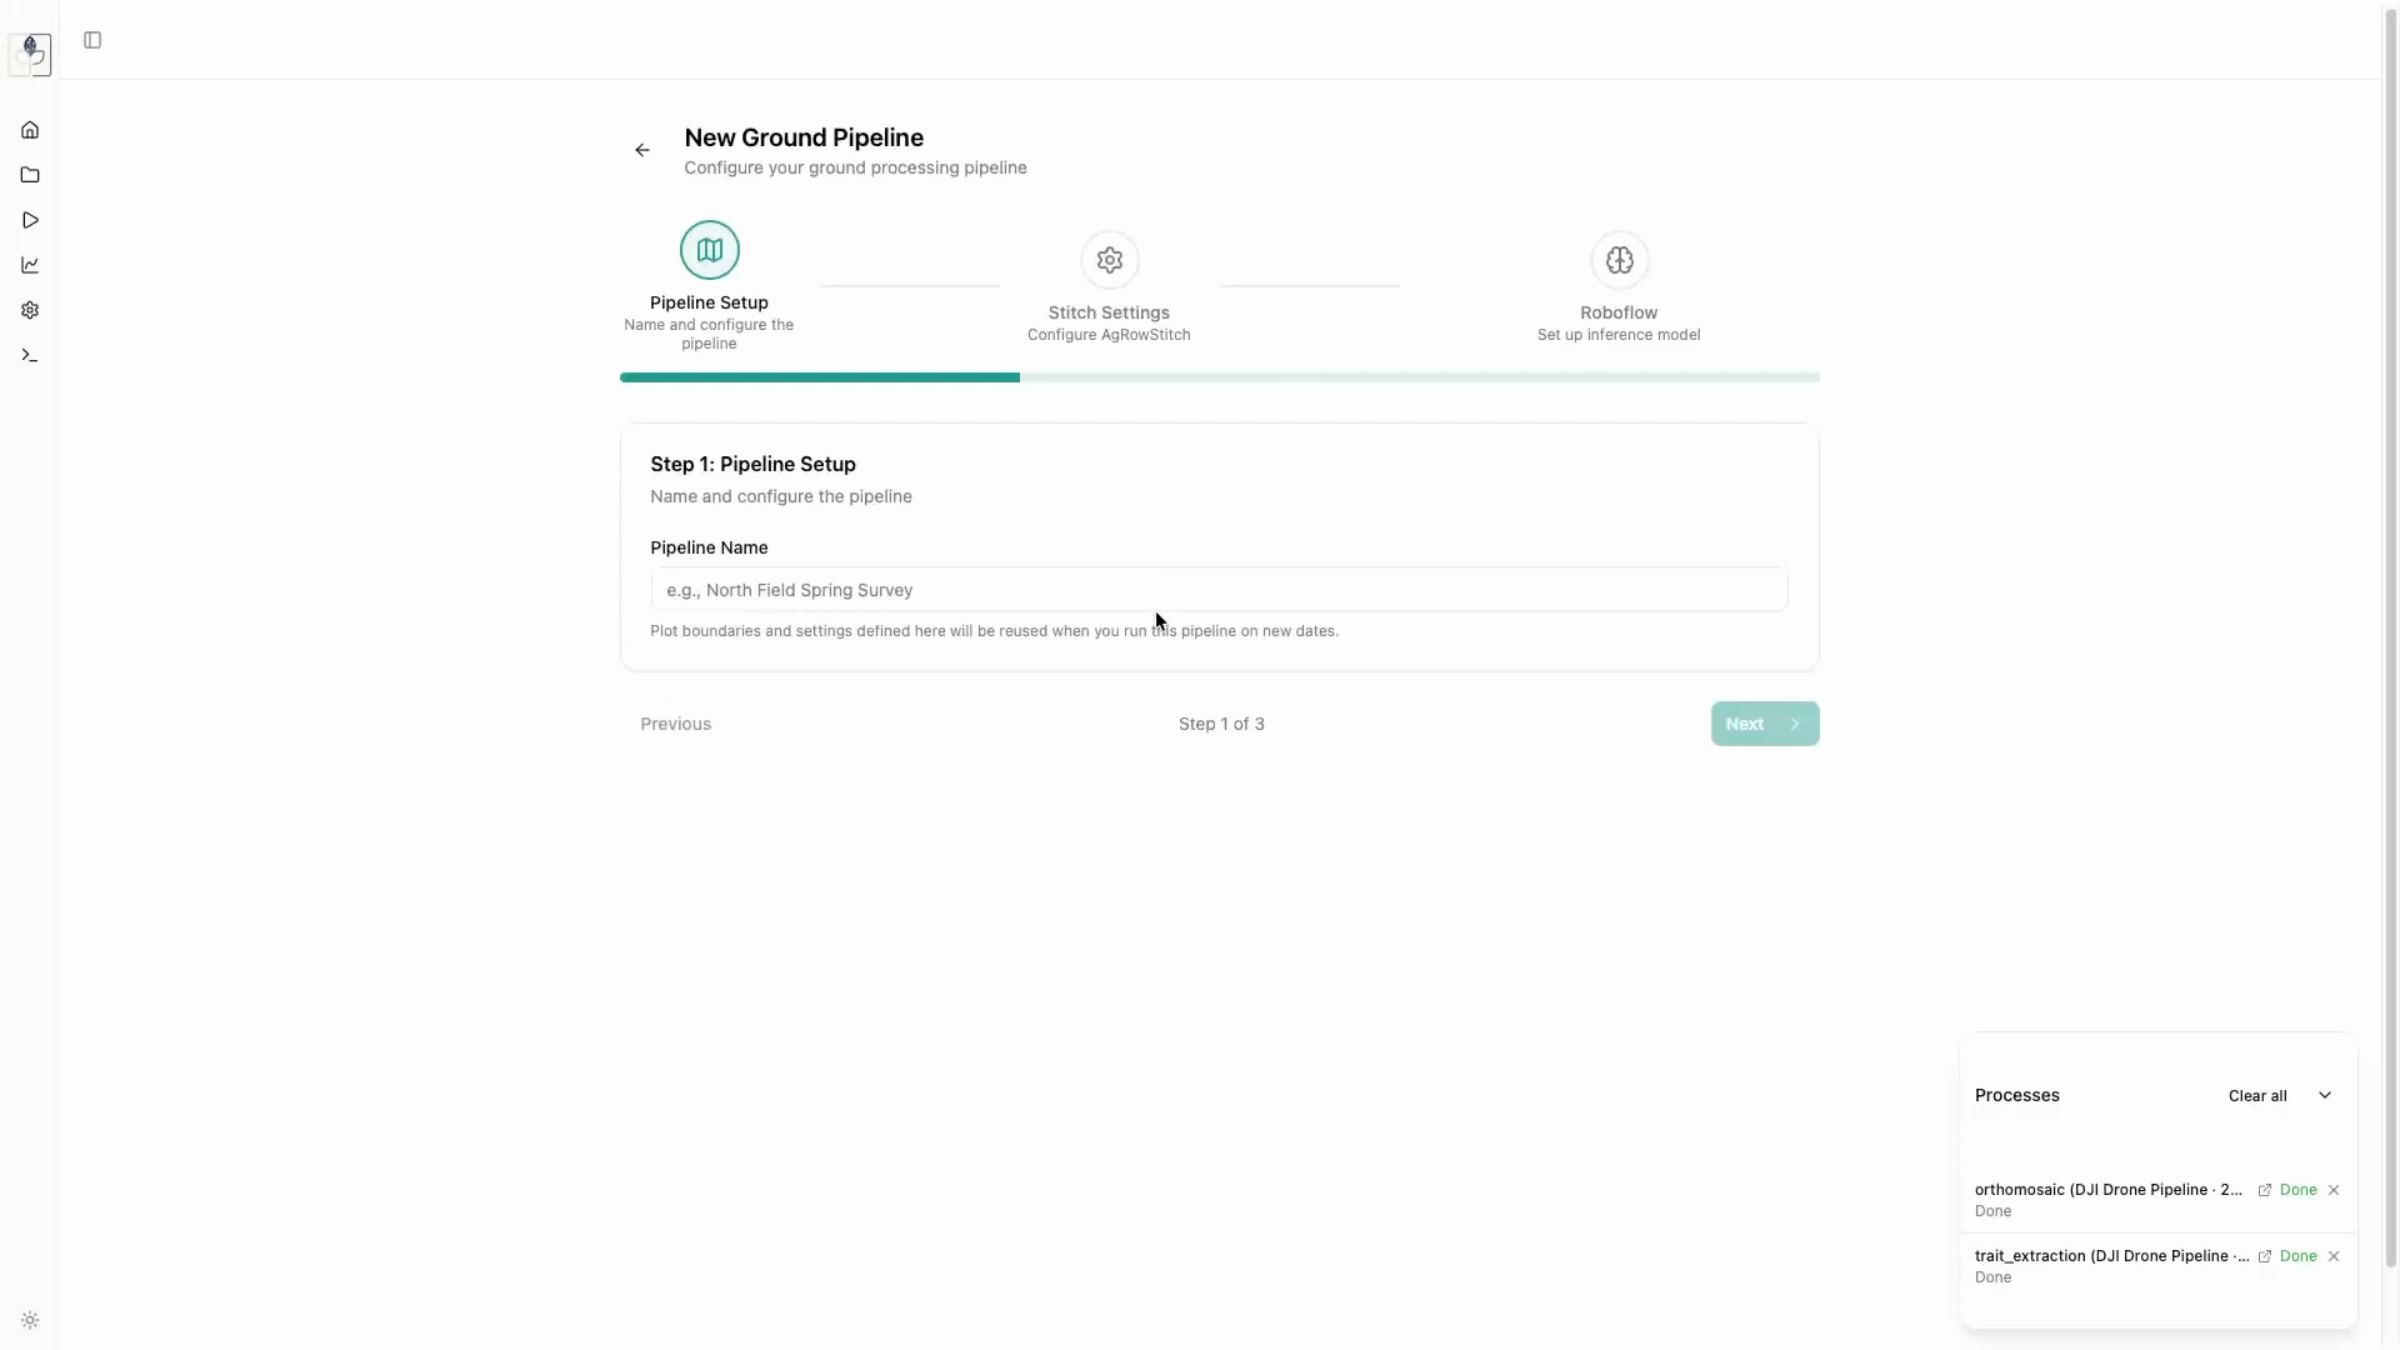
1. Creating a Ground Workspace
Navigate to the Process tab. 1. Create a new workspace specifically for your ground data (e.g., "Amiga Ground 2025"). 2. Select Ground Pipeline when creating the pipeline.
- Actions: Navigate to Process -> Create New Workspace -> Enter Details.
2. Configuration
- Stitch Settings: Choose your platform (e.g., "Amiga"). Predefined settings are available, or you can configure parameters manually.
-
Inference Models: Configure your RoboFlow API key and model ID to run tasks like flower detection. You can toggle between cloud and local server processing.
-
Setup: Select platform -> Configure processing settings -> Define inference models.
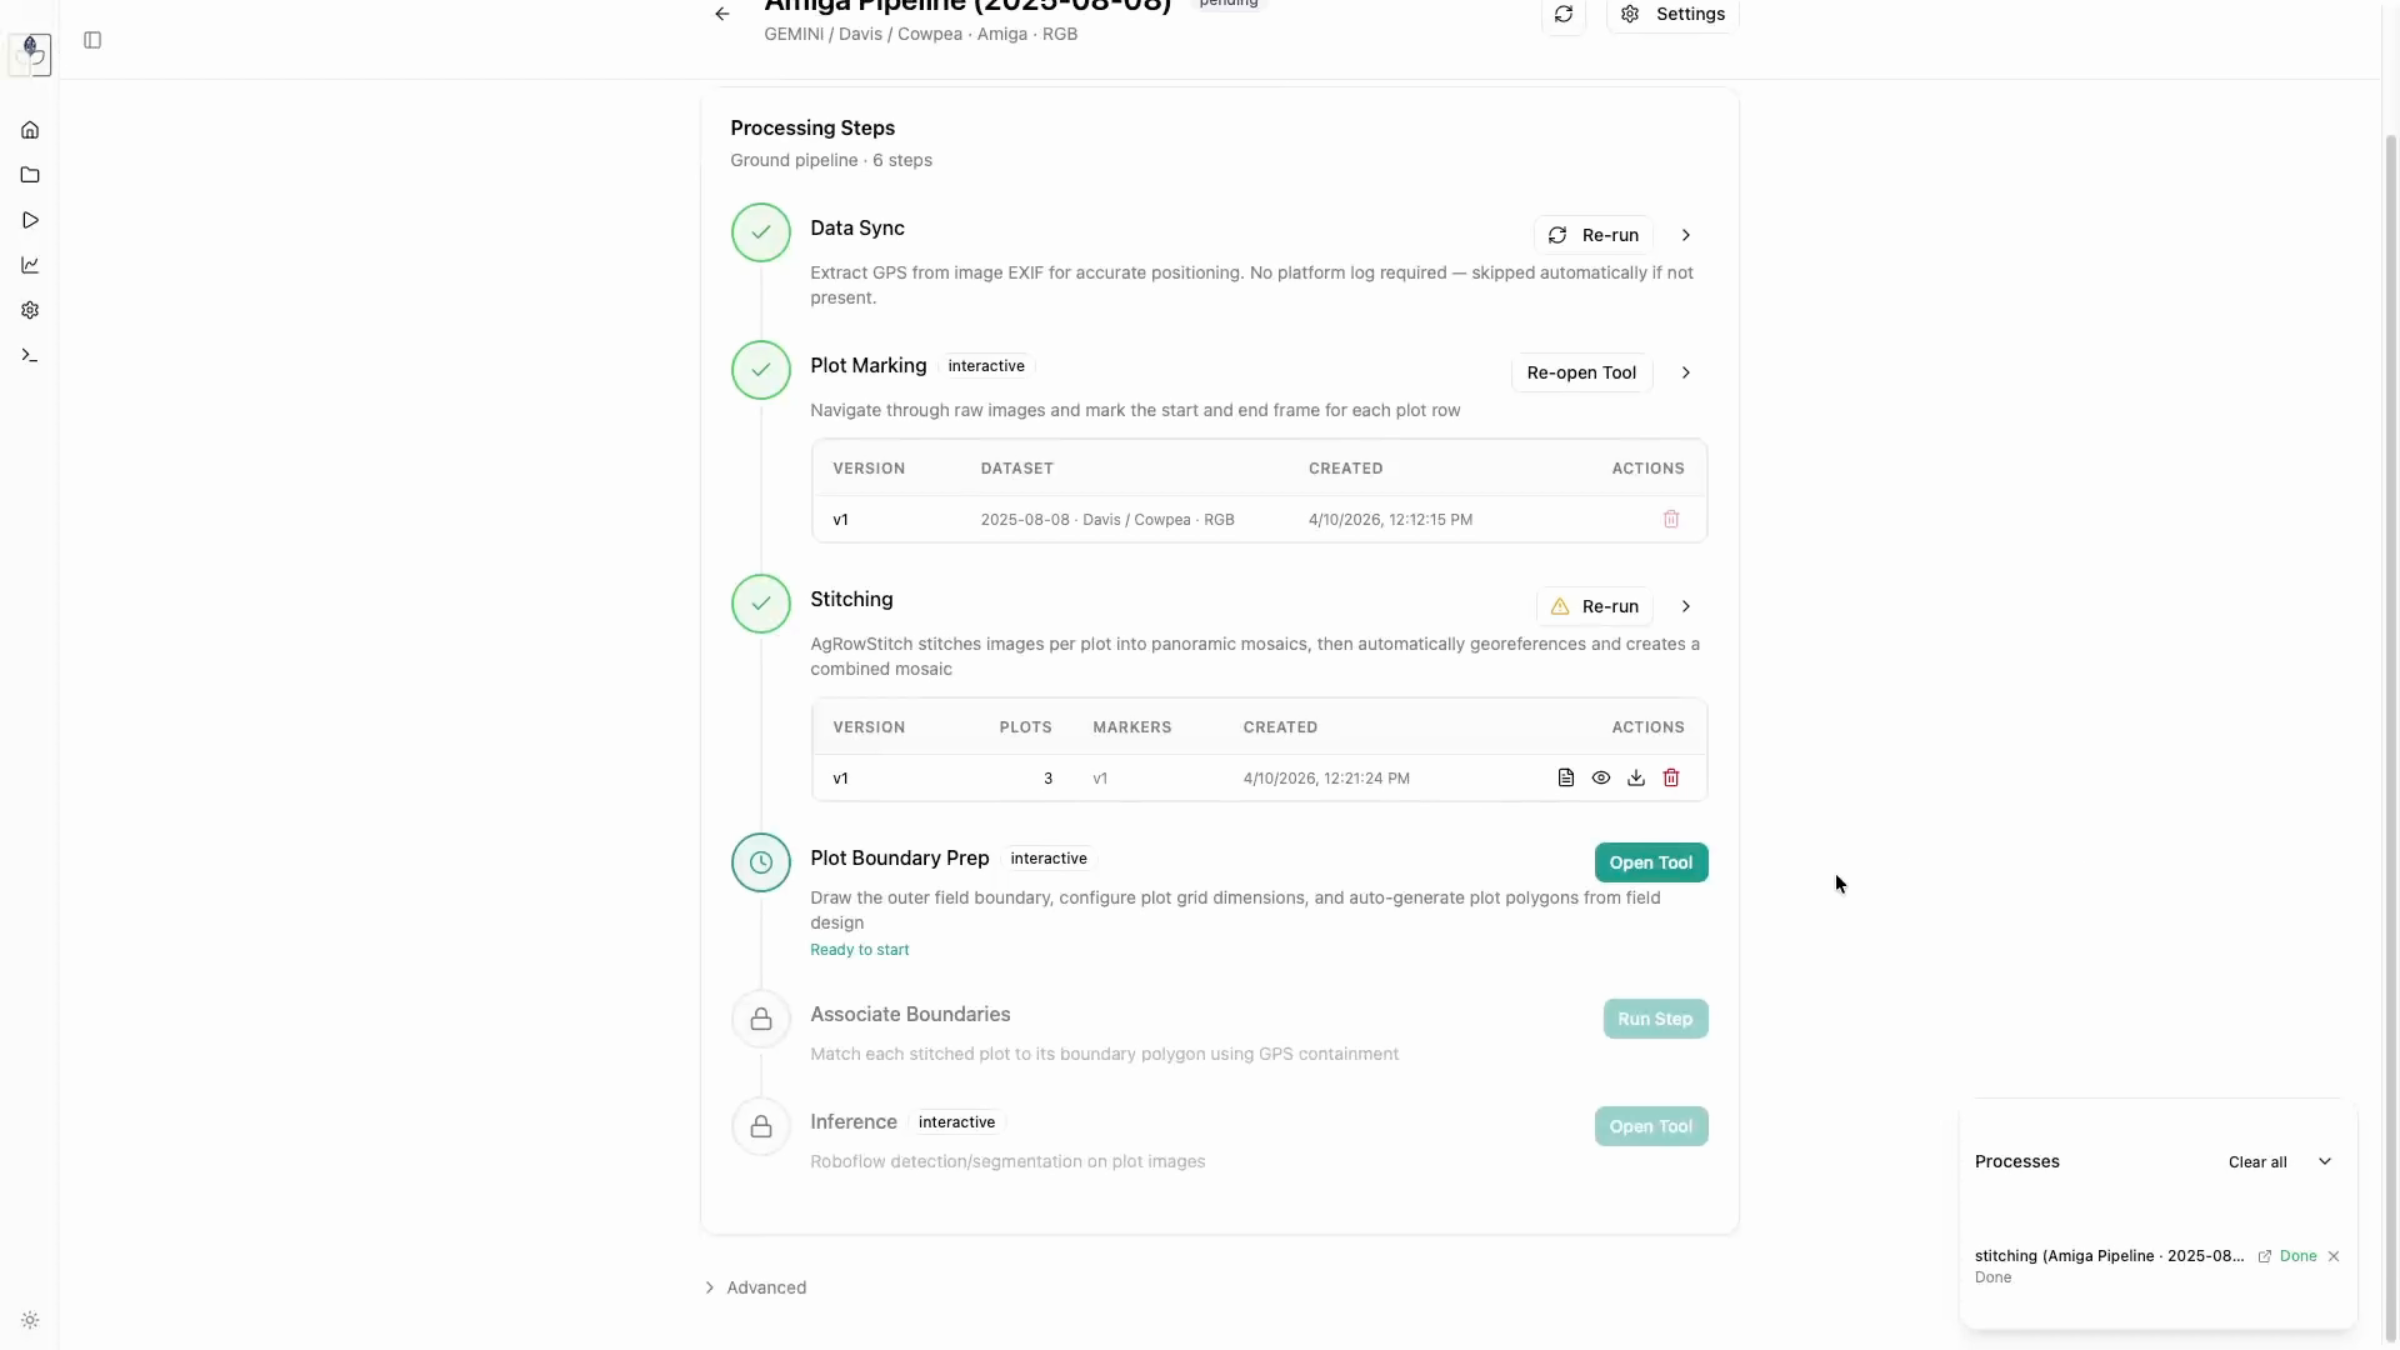
3. Pipeline Execution Steps
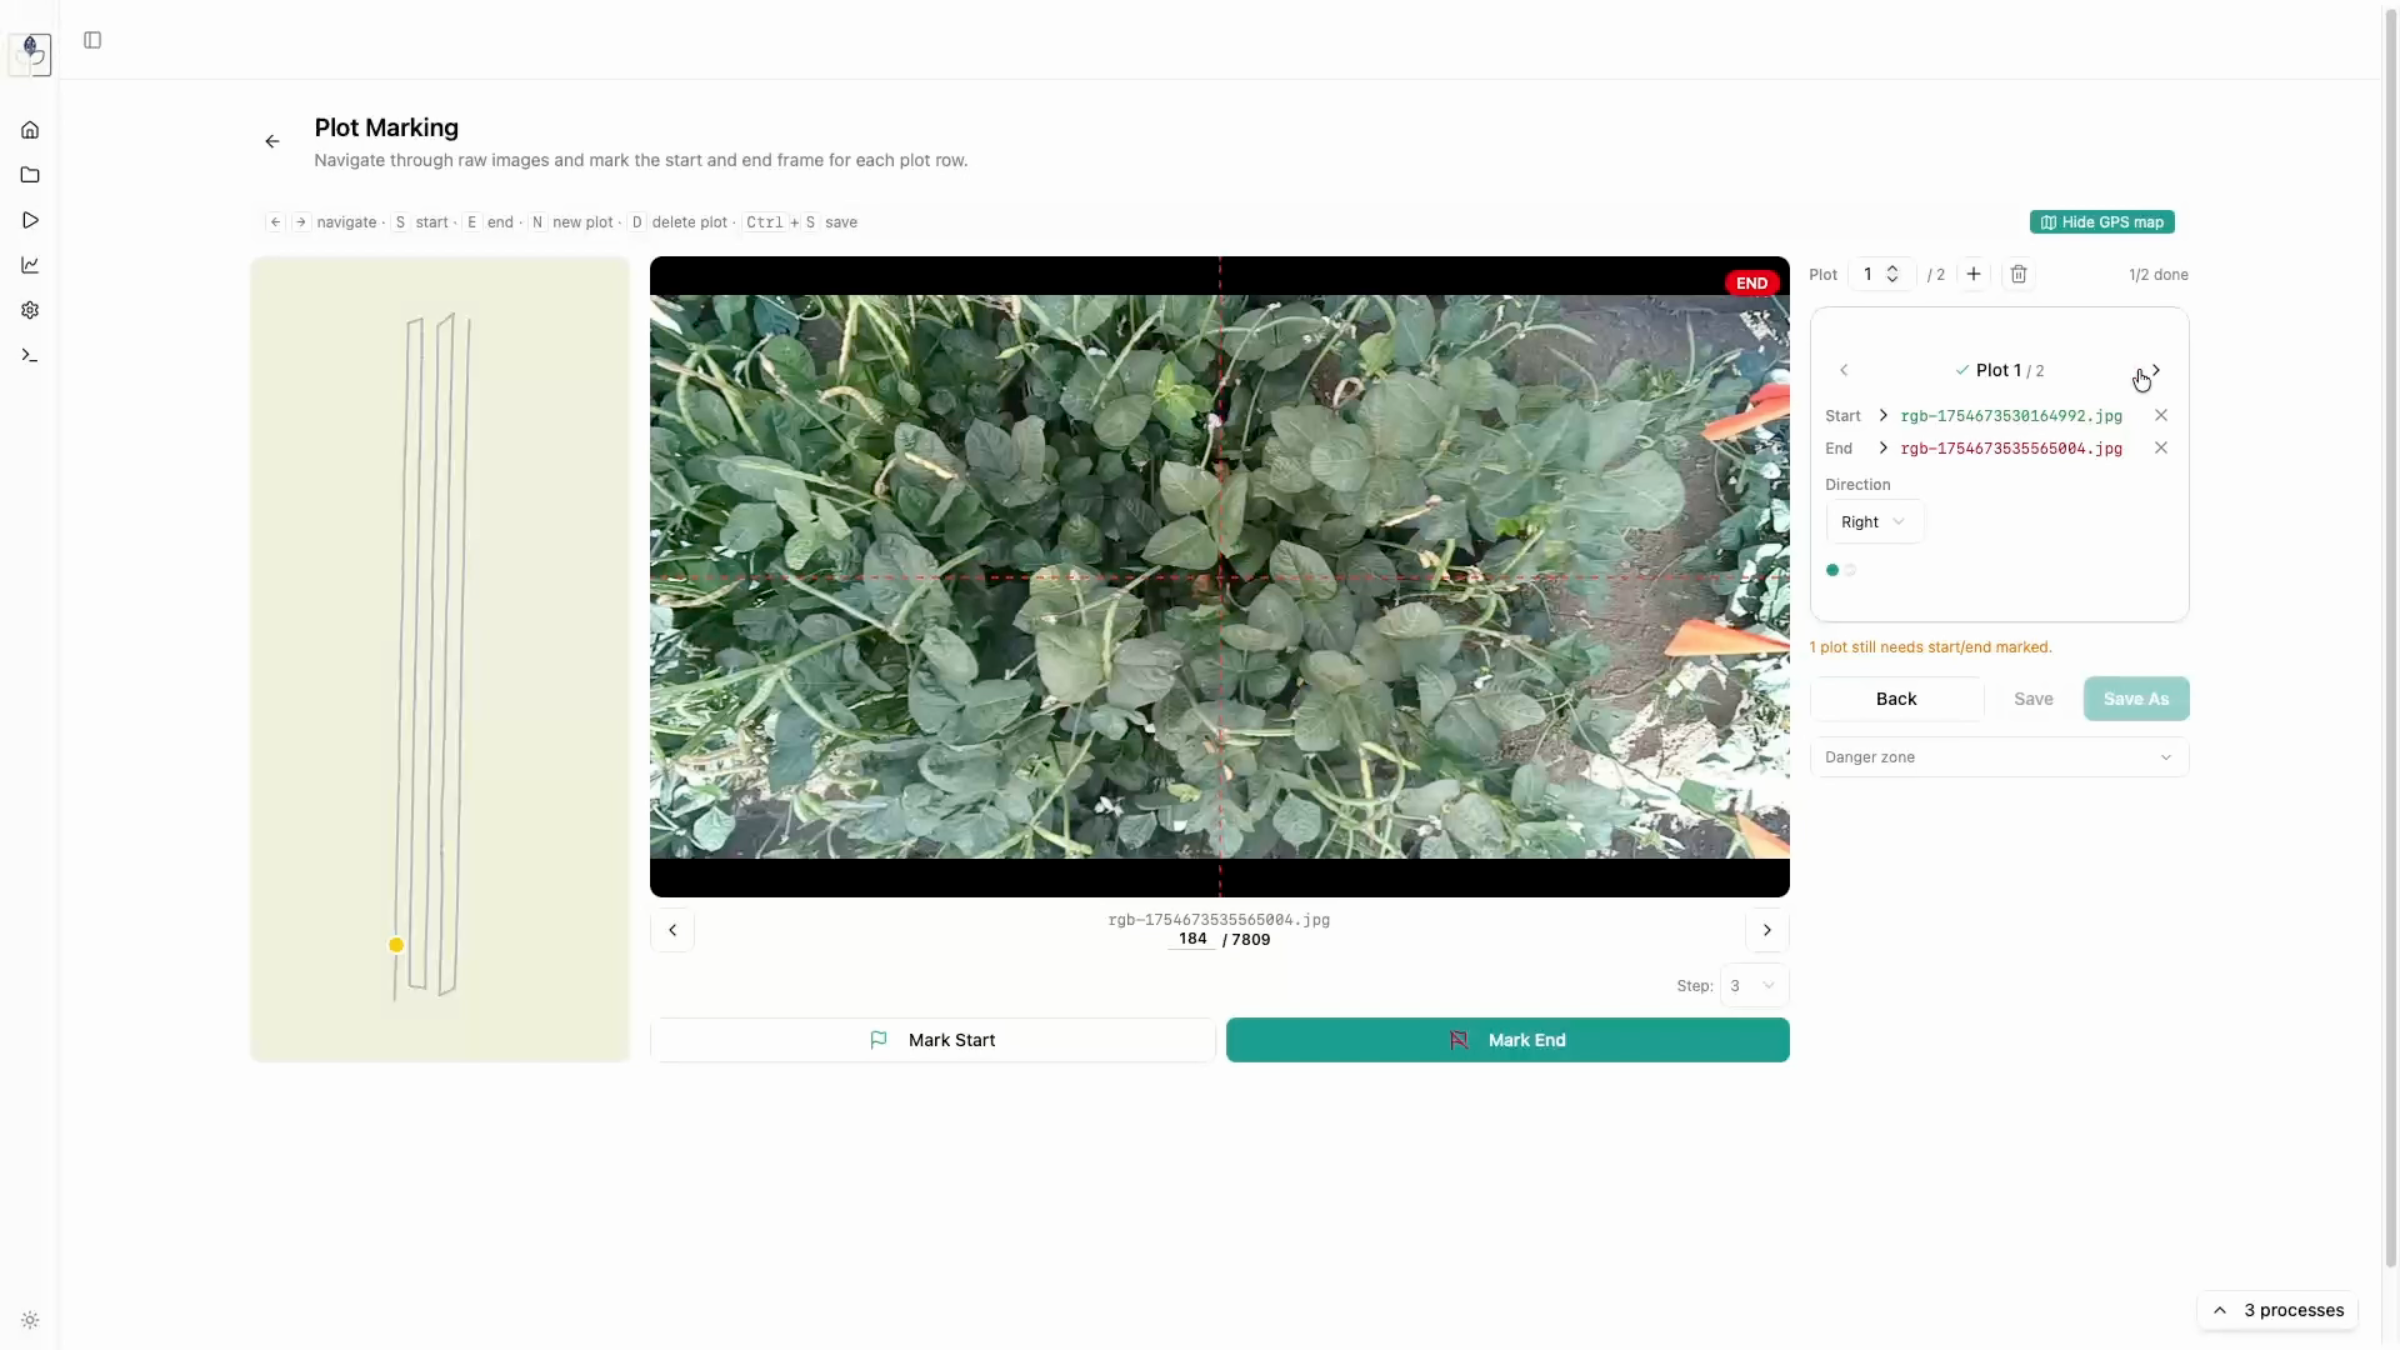
Plot Marking
Unique to the ground pipeline, this tool defines the start and end of each plot in your image sequence.
1. Use keyboard shortcut S to mark the start of a plot and E to mark the end.
2. Select the Stitch Direction (e.g., Right).
3. Use the GPS Map view to track the rover's path as a quality check.
4. Press N to start marking the next plot.
- Marking tools: S (Start) -> E (End) -> N (New plot) -> GPS Map check.
Stitching
Run the stitching step once your plots are marked. - Optional Cropping: Use the crop tool in settings to remove inconsistent lighting and ensure a clean stitch. - Rerun as needed to fine-tune stitching parameters.
- Stitching workflow: Optional crop -> Configure params -> Run stitch.
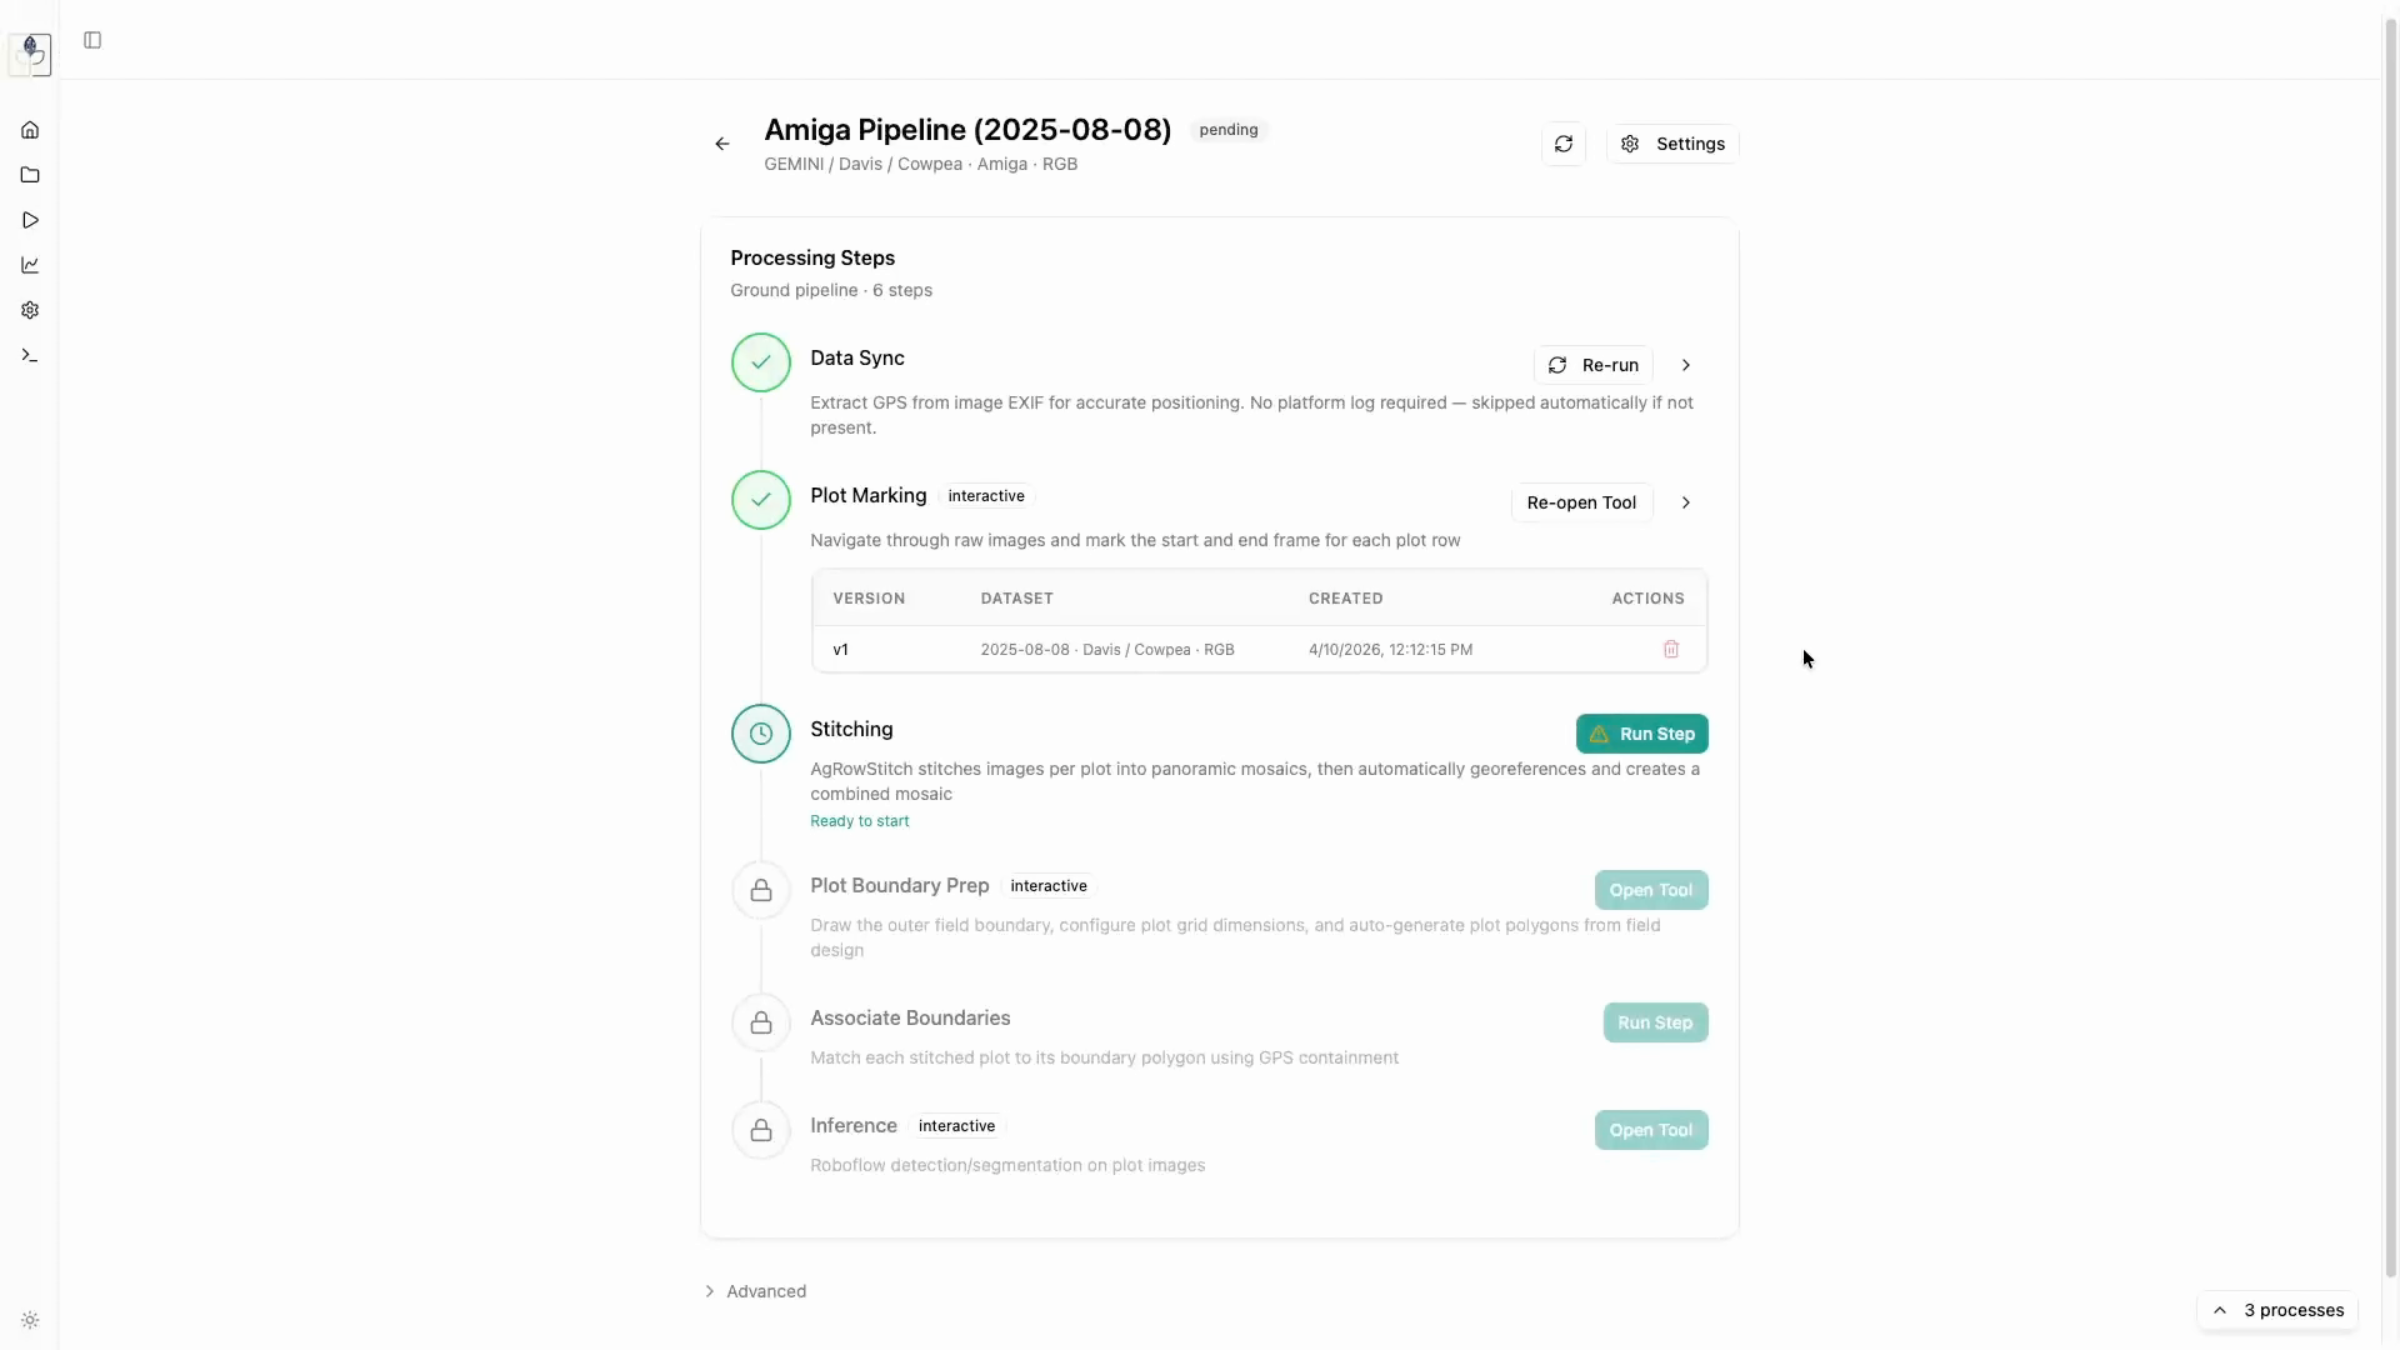
Boundary Preparation and Association
- Upload your field design CSV and map columns (
row,col,plot,accession). - The population boundary will auto-generate; adjust if necessary.
-
Use the Associate Boundaries step to link the field design metadata to your stitched plots.
-
Field Design: Upload/map CSV -> Auto-generate/Adjust boundary -> Associate.
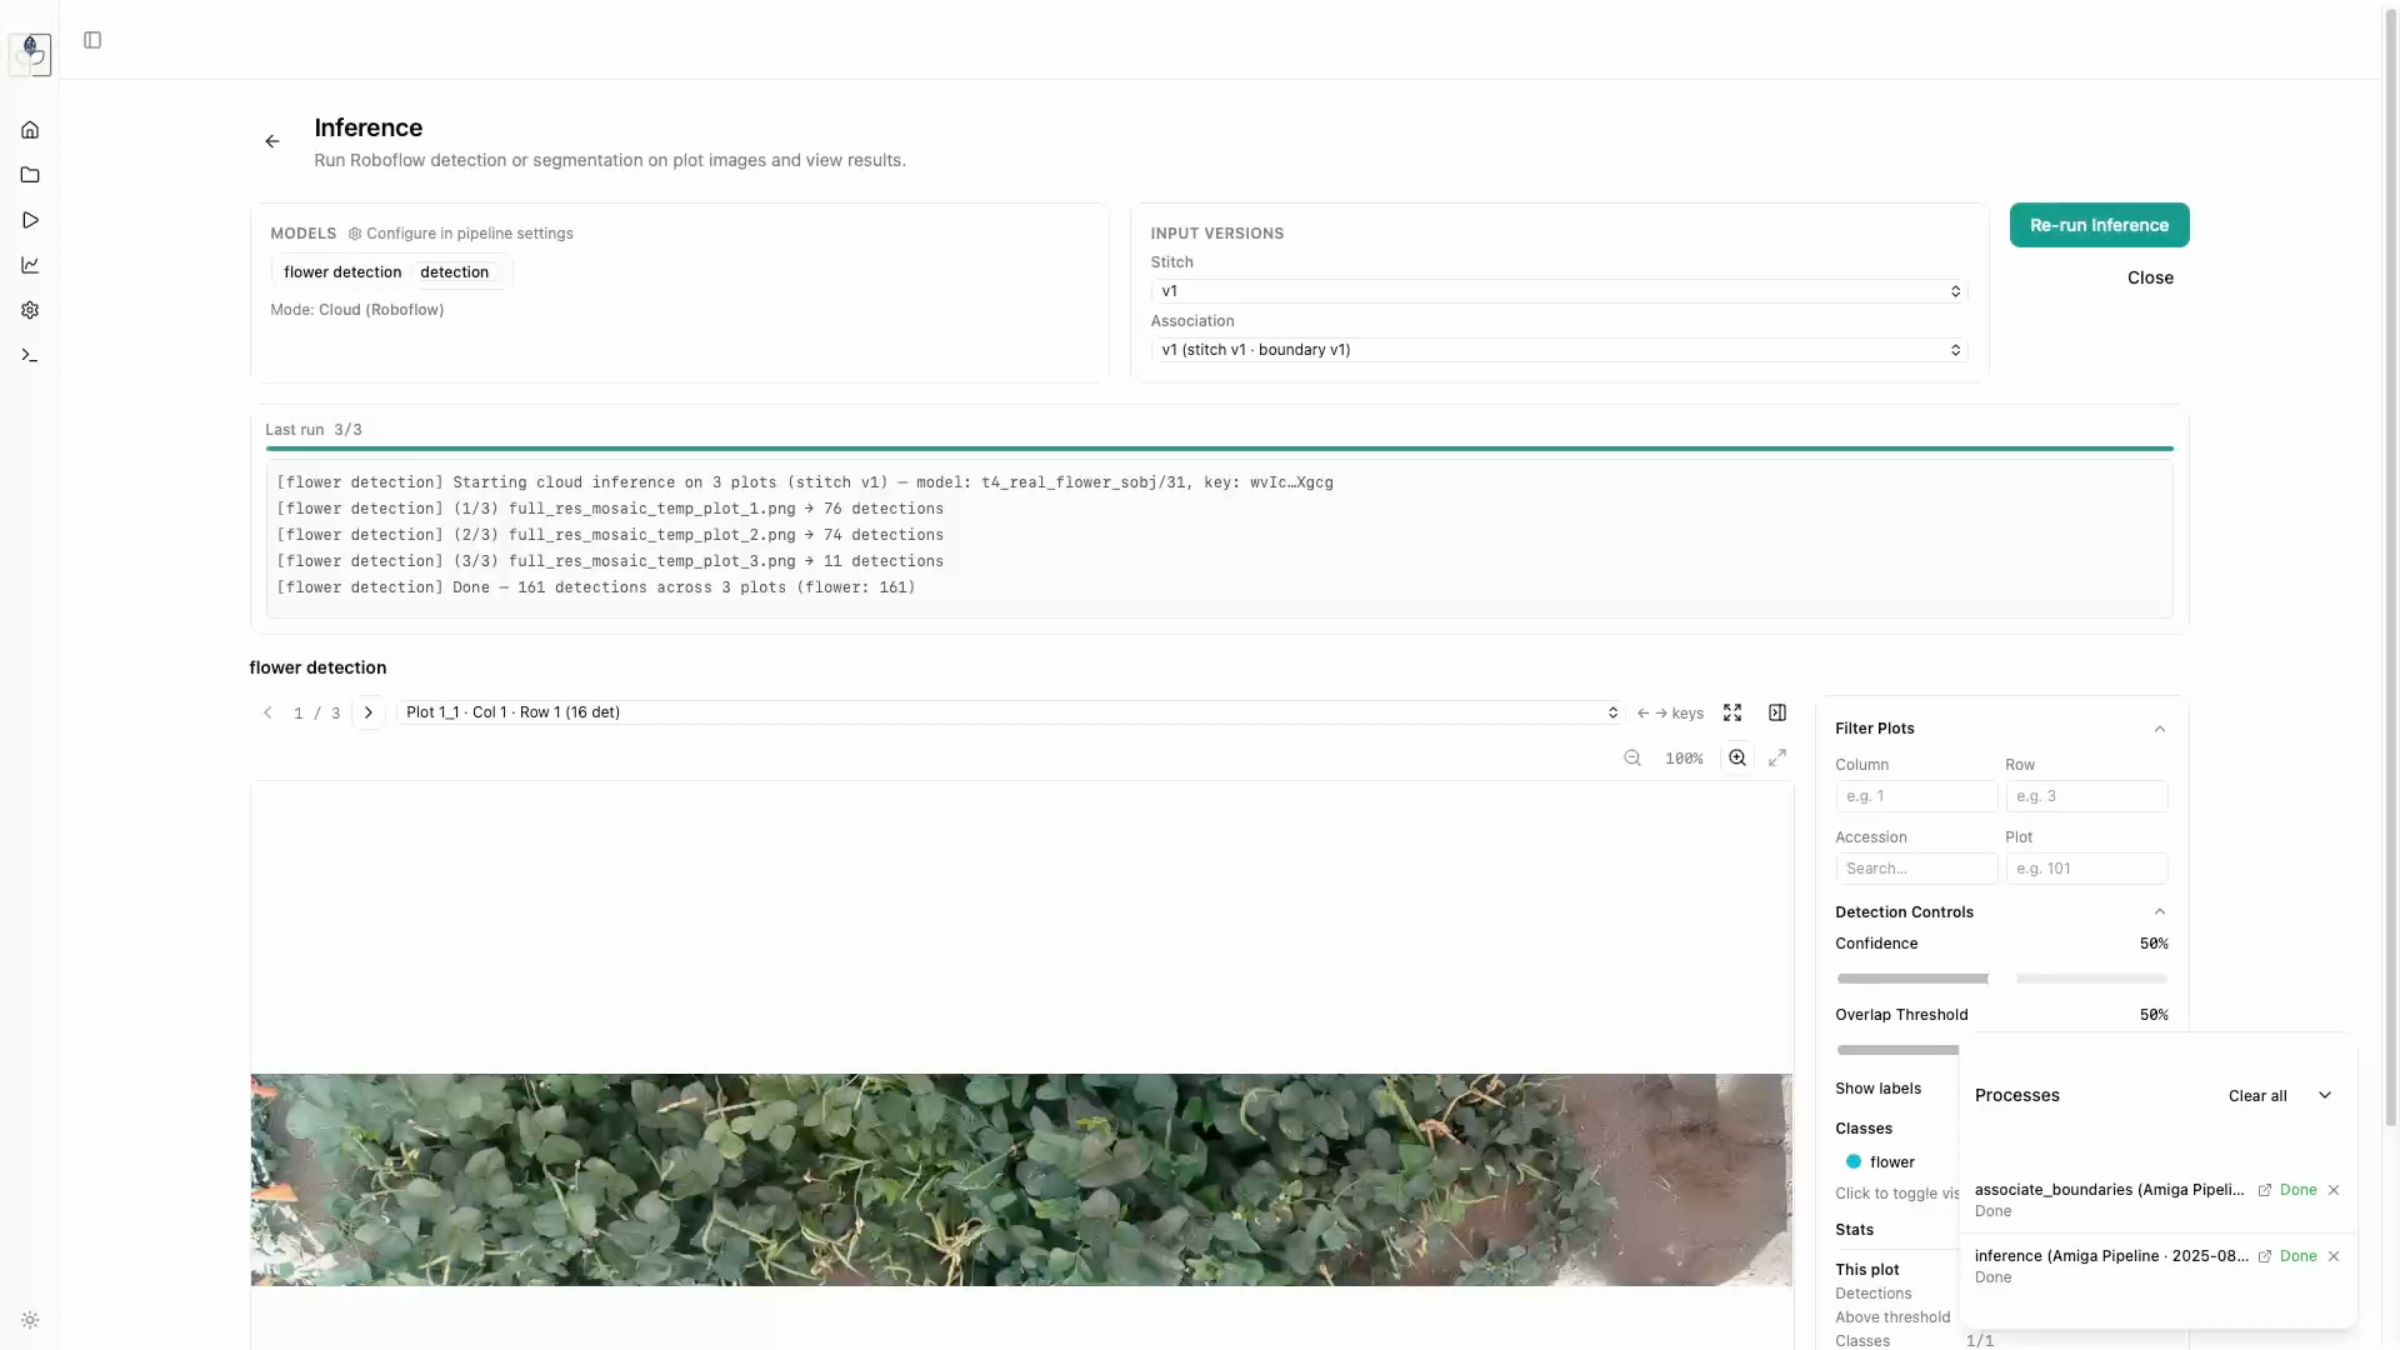
Inference
Run your configured RoboFlow model. You can tune detection results by adjusting: - Confidence Threshold: Lower this to catch more detections if they are being missed. - Overlap Threshold: Adjust to handle overlapping bounding boxes. Apply these thresholds to generate your final trait output.
- Tuning: Adjust confidence/overlap thresholds -> Apply settings.